Getting Started with React Leaflet
Free
Starter
Standard
Professional
If you need to visualize geospatial data in a web application, using React can greatly simplify your life as a developer. The benefits are especially obvious if you're working with large amounts of data or need to respond to filters and other user or backend actions.
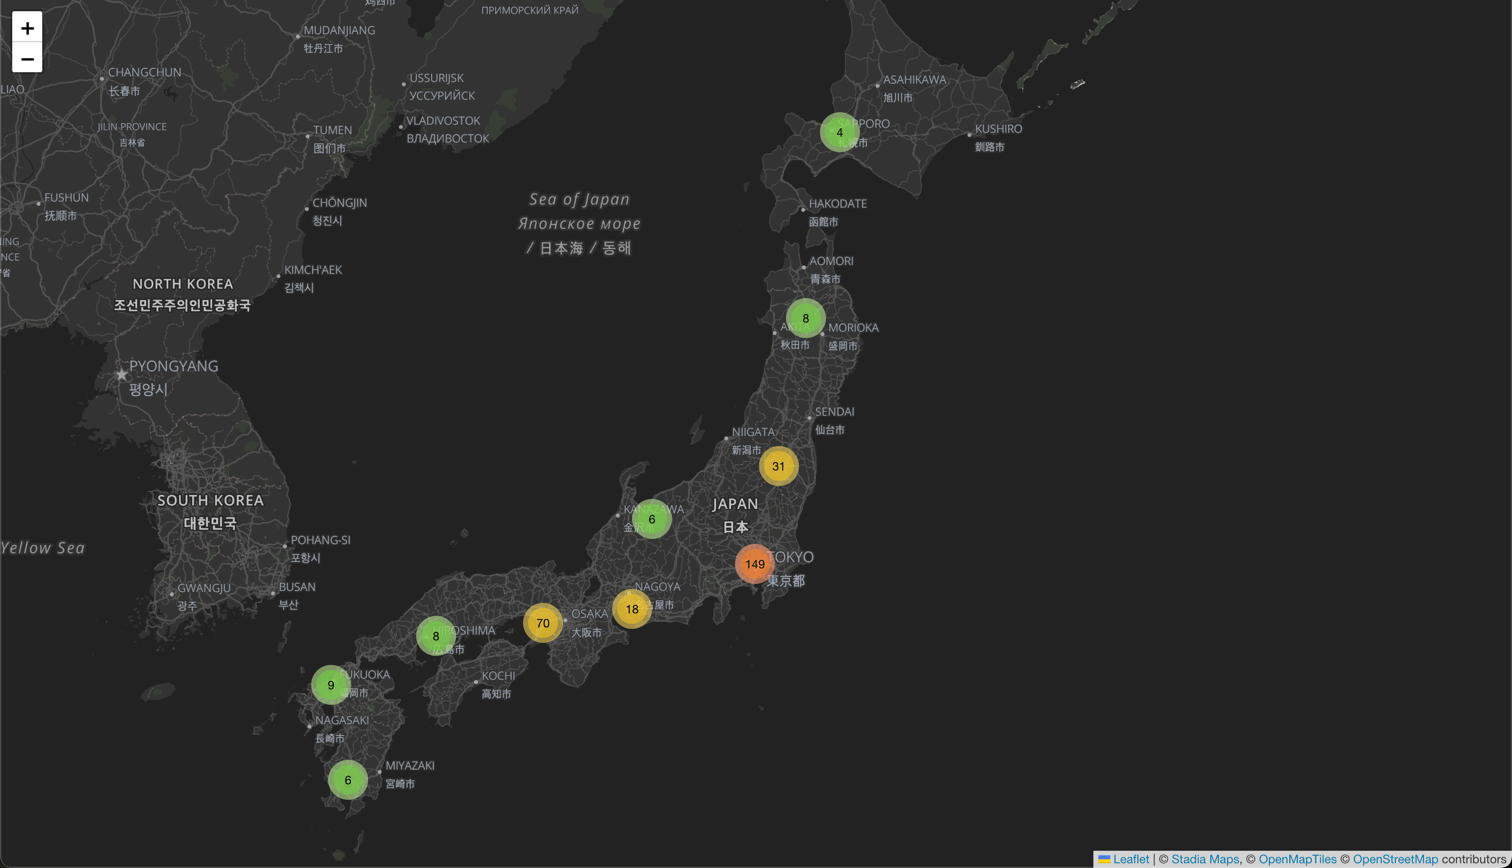
This tutorial will show you how to use Leaflet, a battle-tested mapping library, with React to make an interactive map of every video arcade in Japan.
Demo Code
You can clone the full code for this tutorial from GitHub and follow along to save typing.
Create a React App
If you don't have an existing React app, it's easy to create one!
npx create-react-app my-app
Install Dependencies
We'll use Leaflet and its React wrapper, React Leaflet
as the core map components. react-leaflet-cluster
will help us group nearby markers into clusters. You can install these using
npm or your preferred package manager.
cd my-app
npm install --save leaflet react-leaflet react-leaflet-cluster
Download Data
We also need some data to visualize! We've already done the work for you and created a JSON file of all the arcades in Japan, which you can download and use in your project.
Import and Setup
Before we get to the maps, you'll need some boilerplate at the top of your component. If you don't import the Leaflet CSS, styling of many elements (most obviously the markers) will break.
import 'leaflet/dist/leaflet.css'
import {MapContainer, Marker, Popup} from 'react-leaflet'
import L from 'leaflet'
import MarkerClusterGroup from "react-leaflet-cluster";
import {MapLibreTileLayer} from "./MapLibreTileLayer.tsx";
import arcades from './arcades.json'
You may also need to include the following JS right after the imports, depending on your webpack configuration. See this GitHub Issue for details.
delete L.Icon.Default.prototype._getIconUrl;

L.Icon.Default.mergeOptions({
  iconRetinaUrl: require('leaflet/dist/images/marker-icon-2x.png'),
  iconUrl: require('leaflet/dist/images/marker-icon.png'),
  shadowUrl: require('leaflet/dist/images/marker-shadow.png')
});
Finally, you'll need to add some CSS to set the height of the map. If the map control doesn't have a specified height, it won't show up at all!
.full-height-map {
  height: 100vh;
}
Add a Map
Now we're ready to start adding a map! In React Leaflet, we do this with the
MapContainer component, which we customize with a few attributes.
We then add a TileLayer which tells Leaflet where to get the basemap tiles.
Tip
Check out the library for more raster map styles.
What does maxBounds do?
The map parameters mostly have self-explanatory
names, but maxBounds deserves a quick explanation. If you don't set this,
scrolling east past Japan will "warp" around back to the US (fine), but your markers
will not be visible when you get around to Japan again!
<MapContainer
className="full-height-map"
center={[38, 139.69222]}
zoom={6}
minZoom={3}
maxZoom={19}
maxBounds={[[-85.06, -180], [85.06, 180]]}
scrollWheelZoom={true}>
<TileLayer
attribution='© <a href="https://stadiamaps.com/" target="_blank">Stadia Maps</a>, © <a href="https://openmaptiles.org/" target="_blank">OpenMapTiles</a> © <a href="https://www.openstreetmap.org/copyright" target="_blank">OpenStreetMap</a>'
url="https://tiles.stadiamaps.com/tiles/alidade_smooth_dark/{z}/{x}/{y}{r}.png"
/>
{/* TODO: Add markers */}
</MapContainer>
Add Some Markers
As part of the tutorial, we've provided Japanese arcade locations in a format called GeoJSON. We won't dive too deep into the details here, but it contains an array of geometric objects called features. Each one contains geometry information (in our case, latitude and longitude) and metadata (the name of the arcade).
We can turn this raw data into markers with the map function,
generating a marker for each arcade. We'll even attach a popup
that shows up on click/tap. You can put pretty much whatever you want in the
popup markup-wise, and can even style them using CSS!
{arcades.features.map((arcade, index) => (
  <Marker
    key={arcade.properties['@id']}
    position={[arcade.geometry.coordinates[1], arcade.geometry.coordinates[0]]}
  >
    <Popup>
      {arcade.properties.name}
      <br />
      {arcade.properties['name:en']}
    </Popup>
  </Marker>
))}
Cluster Markers into Groups
Japan has quite a few arcades and, as you might guess, they tend to be clustered in dense urban areas. Drawing hundreds of markers in a small area isn't particularly efficient for your web browser, nor does it look very good.
We can make our arcade map much nicer by clustering markers into groups, only
showing individual markers if there is enough space. All you have to do
is wrap the markers in a MarkerClusterGroup. Magic!
<MarkerClusterGroup>
  {/* Markers */}
</MarkerClusterGroup>
Bring it all Together
We now have all the elements for our Japanese arcade map! We've put all the pieces together for you on GitHub to save typing.
For local development on a web server at localhost or 127.0.0.1,
you can get started without any API keys or domain setup!
For mobile, backend, and non-local web development, you'll need either domain auth or an API key. If you don't already have a Stadia Maps account, sign up for a free to get started.
Domain-based authentication
Domain-based authentication is the easiest form of authentication for production web apps. No additional application code is required, and you don't need to worry about anyone scraping your API keys. We recommend this for most browser-based applications.
- Sign in to the client dashboard.
- Click "Manage Properties."
- Under "Authentication Configuration," click the button to add your domain.
API key authentication
Authenticating requests via API key
You can authenticate your requests by adding an API key to the query string or HTTP header.
https://api.stadiamaps.com/tz/lookup/v1?lat=59.43696&lng=24.75357&api_key=YOUR-API-KEY
Authorization: Stadia-Auth YOUR-API-KEY
The simplest is to add a query string parameter api_key=YOUR-API-KEY to your request URL.
For example, to access the /tz/lookup API endpoint, your request URL might look like this.
You can also use an Authorization HTTP header instead of a query string
as shown below.
Don't forget the Stadia-Auth prefix!
How to get an API key
Don't have an API key yet? Follow these easy steps!
- Sign in to the client dashboard. (If you don't have an account yet, sign up for free; no credit card required!)
- Click "Manage Properties."
- If you have more than one property (ex: for several websites or apps), make sure you have selected the correct property from the dropdown at the top of the page.
- Under "Authentication Configuration," you can generate, view or revoke your API key.
Video: How to generate your API key
Next Steps
React Leaflet has a lot of features not covered in this tutorial, including shape layers, draggable markers, and tooltips. Check out their documentation to learn more.
Once your amazing app is ready to move beyond localhost, sign up for a free
Stadia Maps account, and we'll walk through the next steps.