Getting started with geopandas and contextily
Free
Starter
Standard
Professional
geopandas is an open source project
that makes working with geospatial data easier in Python
by extending pandas with spatial support.
contextily is a Python library that retrieves map tiles from the Internet,
allowing you to add basemaps to matplotlib.
In this tutorial, we'll show you how to load a dataset with geopandas
and display the data over one of our basemaps using contextily.
At the end, you'll have everything you need to create your first maps.
Install or update geopandas and contextily
For this quickstart tutorial, we will need three libraries installed:
geopandas, geodatasets, and contextily.
Please use your preferred installation process for your Python environment.
Here's how to install them with pip:
pip install geopandas geodatasets contextily
Set up API key authentication
You'll need a Stadia Maps API key to access the tiles in contextily.
- Sign in to the client dashboard. (If you don't have an account yet, sign up for free; no credit card required!)
- Click "Manage Properties."
- If you have more than one property (ex: for several websites or apps), make sure you have selected the correct property from the dropdown at the top of the page.
- Under "Authentication Configuration," you can generate, view or revoke your API key.
Video: How to generate your API key
Once generated, replace YOUR-API-KEY in the code below with your key.
Be mindful with the management of your API keys.
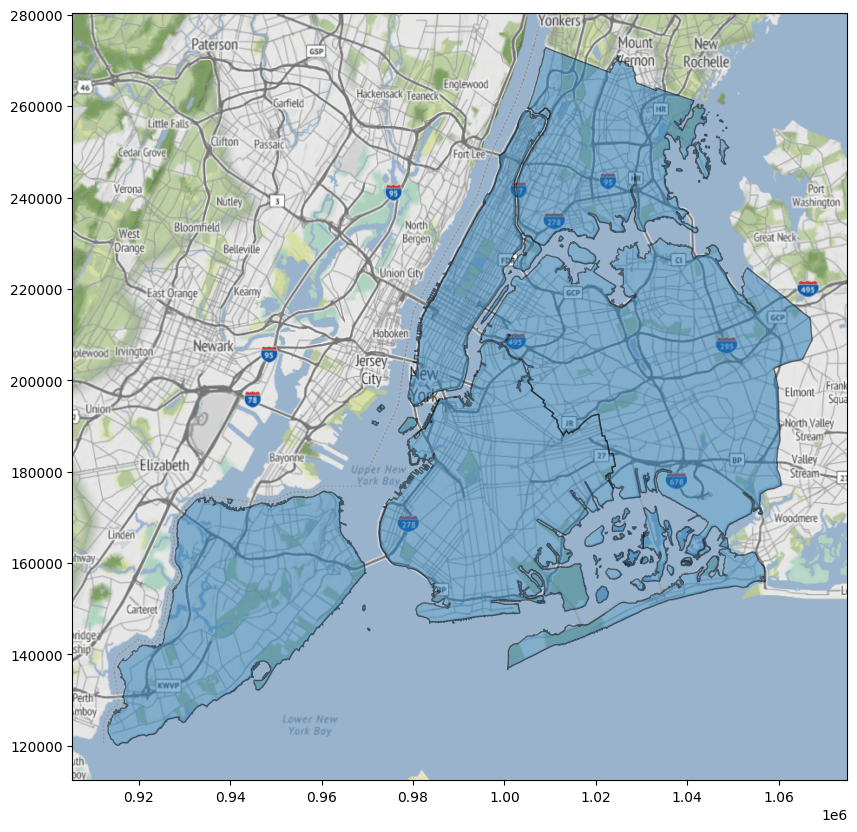
Creating your first map
You are now ready to build your visualization!
We'll use the New York boroughs dataset from geodatasets.
Many others are also available with the package.
# Import the necessary libraries
import geopandas
import geodatasets
import contextily as cx

# Create a dataframe with the New York boroughs sample dataset
df = geopandas.read_file(geodatasets.get_path("nybb"))

# Define the plot size, transparency, and edge color
ax = df.plot(figsize=(10, 10), alpha=0.5, edgecolor="k")

# Add your API key to the desired style from contextily providers
provider = cx.providers.Stadia.StamenTerrain(api_key="YOUR-API-KEY")

# Update the provider URL to include your API key
provider["url"] = provider["url"] + "?api_key={api_key}"

# Draw the basemap under the plot, define the Coordinate Reference System, and add the updated provider object as the source
cx.add_basemap(ax, crs=df.crs, source=provider)
Going deeper
We've only shown a small part of what's possible with geopandas and contextily.
You can learn more about geopandas at geopandas.org
and contextily at GitHub.