How to get Directions in JavaScript from the Stadia Maps Geospatial API
Free
Starter
Standard
Professional
This tutorial will walk you through the process of getting directions using the Stadia Maps Geospatial APIs. We'll get directions between two points from the Stadia Maps Geospatial API using JavaScript, and visualize the route using MapLibre GL JS. We'll use a few JavaScript libraries, but no special tooling is required and you can easily test everything in your web browser.
A simple route function
Let's start by writing a function that gets a route from the API. We've tried to keep things as simple as possible, leveraging our official JS SDK to do the heavy lifting so that you can focus on the parameters.
function simple_route(startLat, startLon, endLat, endLon, costing, callback) {
  const api = new stadiaMapsApi.RoutingApi();

  // Build a request body for the route request
  const req = {
    locations: [
      {
        lat: startLat,
        lon: startLon,
        type: "break"
      },
      {
        lat: endLat,
        lon: endLon,
        type: "break"
      }
    ],
    "costing": costing,
  };

  api.route({routeRequest: req}).then(callback).catch(function () {
    console.error(e);
  });
}
The first four parameters (startLat, startLon, etc.) are the coordinates you want the route to start and end
at.
The next argument is the routing profile, which specifies the mode of travel. The most common
values are auto, bicycle, and pedestrian. (The API parameter is called the "costing model.") You can either pass
these as strings or use the predefined constants to take advantage of code completion in your IDE.
Finally, the function takes a callback argument. This is a simple JavaScript function that does something with the
response.
The following code will get driving directions from (66.543333, 25.8475) to (59.437222, 24.745278) and log the response to the console.
simple_route(66.543333, 25.8475, 59.437222, 24.745278, stadiaMapsApi.CostingModel.Auto, function(response) {
    console.log(response);
});
Polyline decoding
The API returns the shape of the route as an encoded polyline. To visualize this on a map, we need to decode this back into a set of coordinates. For this tutorial, we'll decode the polyline using the Mapbox polyline library. We opt to decode it as GeoJSON, since this the easiest to work with in MapLibre GL JS.
polyline.toGeoJSON(shape, 6)
Pulling it all together
Now that we have all the data we need, let's pull it all together into a web page! Click the button below to experiment with it in JSFiddle.
<!DOCTYPE html>
<html>
<head>
<meta charset="utf-8" />
<title>Vector Map Demo</title>
<meta name="viewport" content="initial-scale=1,maximum-scale=1,user-scalable=no" />
<script type="text/javascript" src="//unpkg.com/maplibre-gl@5.23.0/dist/maplibre-gl.js"></script>
<script type="text/javascript" src="//unpkg.com/@stadiamaps/api@9"></script>
<link href="//unpkg.com/maplibre-gl@5.23.0/dist/maplibre-gl.css" rel="stylesheet" />
<!-- We'll load the polyline library from unpkg for convenience in this tutorial for simplicity -->
<script type="text/javascript" src="https://unpkg.com/@mapbox/polyline"></script>
<style type="text/css">
body {
margin: 0;
padding: 0;
}
#map {
position: absolute;
top: 0;
bottom: 0;
width: 100%;
}
</style>
</head>
<body>
<div id="map"></div>
<script type="text/javascript">
function simple_route(startLat, startLon, endLat, endLon, costing, callback) {
const api = new stadiaMapsApi.RoutingApi();
// Build a request body for the route request
const req = {
locations: [
{
lat: startLat,
lon: startLon,
type: "break"
},
{
lat: endLat,
lon: endLon,
type: "break"
}
],
"costing": costing,
};
api.route({routeRequest: req}).then(callback).catch(function () {
console.error(e);
});
}
var map = new maplibregl.Map({
container: "map",
style: "https://tiles.stadiamaps.com/styles/alidade_smooth.json", // Style URL; see our documentation for more options
center: [12, 53], // Initial focus coordinate
zoom: 4
});
// MapLibre GL JS does not handle RTL text by default,
// so we recommend adding this dependency to fully support RTL rendering if your style includes RTL text
maplibregl.setRTLTextPlugin('https://unpkg.com/@mapbox/mapbox-gl-rtl-text@0.4.0/dist/mapbox-gl-rtl-text.js');
// Add zoom and rotation controls to the map.
map.addControl(new maplibregl.NavigationControl());
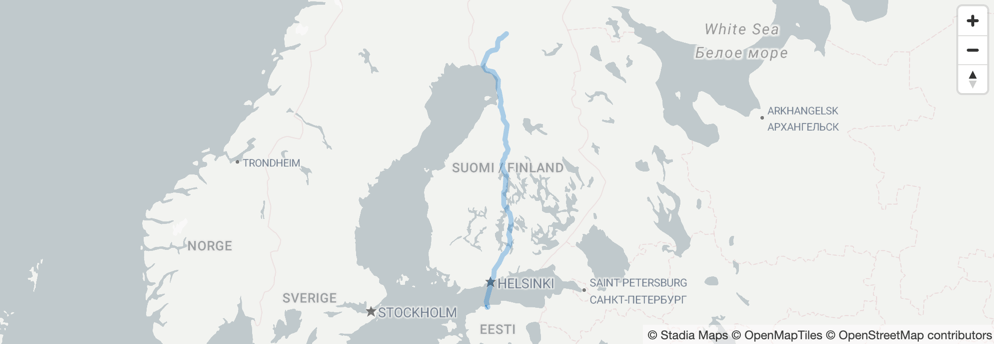
// Find a route between Santa's Village and Tallinn,
// where a legend claims the first Christmas tree may
// have appeared: https://www.visitestonia.com/en/why-estonia/the-tale-of-tallinns-most-famous-christmas-tree.
// We'll assume that Santa's Reindeer are on strike,
// so he has to drive a truck. (In case you're wondering
// how he gets across the water, there is a ferry involved.)
simple_route(66.543333, 25.8475, 59.43995, 24.73715, stadiaMapsApi.CostingModel.Truck, function(response) {
// Construct a bounding box in the sw, ne format required by MapLibre. Note the lon, lat order.
var sw = [response.trip.summary.minLon, response.trip.summary.minLat];
var ne = [response.trip.summary.maxLon, response.trip.summary.maxLat];
// Zoom to the new bounding box to focus on the route,
// with a 50px padding around the edges. See https://maplibre.org/maplibre-gl-js/docs/API/classes/Map/#fitbounds
map.fitBounds([sw, ne], {padding: 50});
// For each leg of the trip...
response.trip.legs.forEach(function(leg, idx) {
// Add a layer with the route polyline as an overlay on the map
var layerID = "leg-" + idx; // Unique ID with request ID and leg index
// Note: Our polylines have 6 digits of precision, not 5
var geometry = polyline.toGeoJSON(leg.shape, 6);
map.addLayer({
"id": layerID,
"type": "line",
"source": {
"type": "geojson",
"data": {
"type": "Feature",
"properties": {},
"geometry": geometry
}
},
"layout": {
"line-join": "round",
"line-cap": "round"
},
"paint": {
"line-color": "#0072ce",
"line-opacity": 0.3,
"line-width": 5
}
});
});
});
</script>
</body>
</html>
You're now able to use the Stadia Maps Geospatial APIs to get routes, parse summary information about the route, and visualize it on a map! This should give you a good foundation on which to build more complex routing applications for the web using the Stadia Maps Geospatial APIs.
Next Steps
Once you're ready to try this outside a local development environment, sign up for a free Stadia Maps account, and we'll guide you through what to do before deploying.
Get Started With a Free Account
Try playing around with the code in an editor like VSCode or WebStorm to take advantage of auto-complete hints. This is a fun way to explore the routing API and discover options. You can also head over to the comprehensive API reference for a definitive list of everything that's available.