How to Get an Elevation Profile with your Route
Free
Starter
Standard
Professional
When we go outside for a run, hike, or ride, elevation is an important factor in how difficult the workout will be. Or, in case you weren't planning on getting a workout, it's nice to know what you're getting into! The Stadia Maps routing APIs offer two important features to help: elevation-aware routing and elevation profiles.
Elevation-aware routing can either avoid or seek out challenging hills when planning a route
for bicycles, pedestrians, or motor scooters.
This is as easy as setting the use_hills parameter in your costing options.
You can read more about that in our guide to getting the best routes for your use case.
Elevation profiles give you a snapshot of the elevation along a route, so you can measure total elevation change, create better calorie estimates, visualize it on a map, and more. This tutorial will cover how to request an elevation profile along with your standard routing API calls, and how to visualize it with Chart.js.
Calculating Routes with an Elevation Profile
First, we'll need a route. We'll use the Stadia Maps Javascript API for this tutorial, but the process is similar for any language. The only thing we'll need to do different from a "normal" route request is add an elevation interval parameter.
Installation Instructions
The Stadia Maps JavaScript/TypeScript SDK is available for any package manager that supports the npm registry.
)
npm install @stadiamaps/api
yarn add @stadiamaps/api
bun add @stadiamaps/api
  const api = new stadiaMapsApi.RoutingApi()

  const locations = [
    { lon: 126.950941, lat: 37.582097 },
    { lon: 126.957916, lat: 37.584465 },
  ]

+ const elevationInterval = 30
  const response = await api.route({
    routeRequest: {
      locations: locations,
      costing: "bicycle",
+     elevationInterval: elevationInterval,
    },
  })
With an elevation interval specified, the API will return data where available (basically everywhere on land). The value is specified in meters. So, what value should we pick?
The elevation data is stored at a 30m sampling resolution internally, so we recommend 30 unless you have a good reason to pick something else. The most common exception is when you don't need very granular data, and you know you'll be working with longer routes. You could increase the interval in this case to save bandwidth.
What about the elevation API? Isn't that more precise?
Our elevation API can access more precise data where it's available. Some regions have up to 5m precision.
However, we recommend against using this for getting an elevation profile of a route. The elevation API gives you "raw" values and is not aware of bridges and tunnels, so it may give technically accurate (from the ground perspective) but also useless responses for routes.
The routing API is aware of bridges and tunnels, and will interpolate elevation along these linearly. This is a huge improvemnet in accuracy!
Interpreting the response
When you set the elevation interval parameter, each leg of the returned route(s)
will include an elevation parameter.
The first value corresponds to the start of the route, and the values represent elevation readings
at each additional interval (e.g. 30 meters).
If your route request units are metric (the default), the elevation is measured in meters.
Otherwise, they are measured in feet.
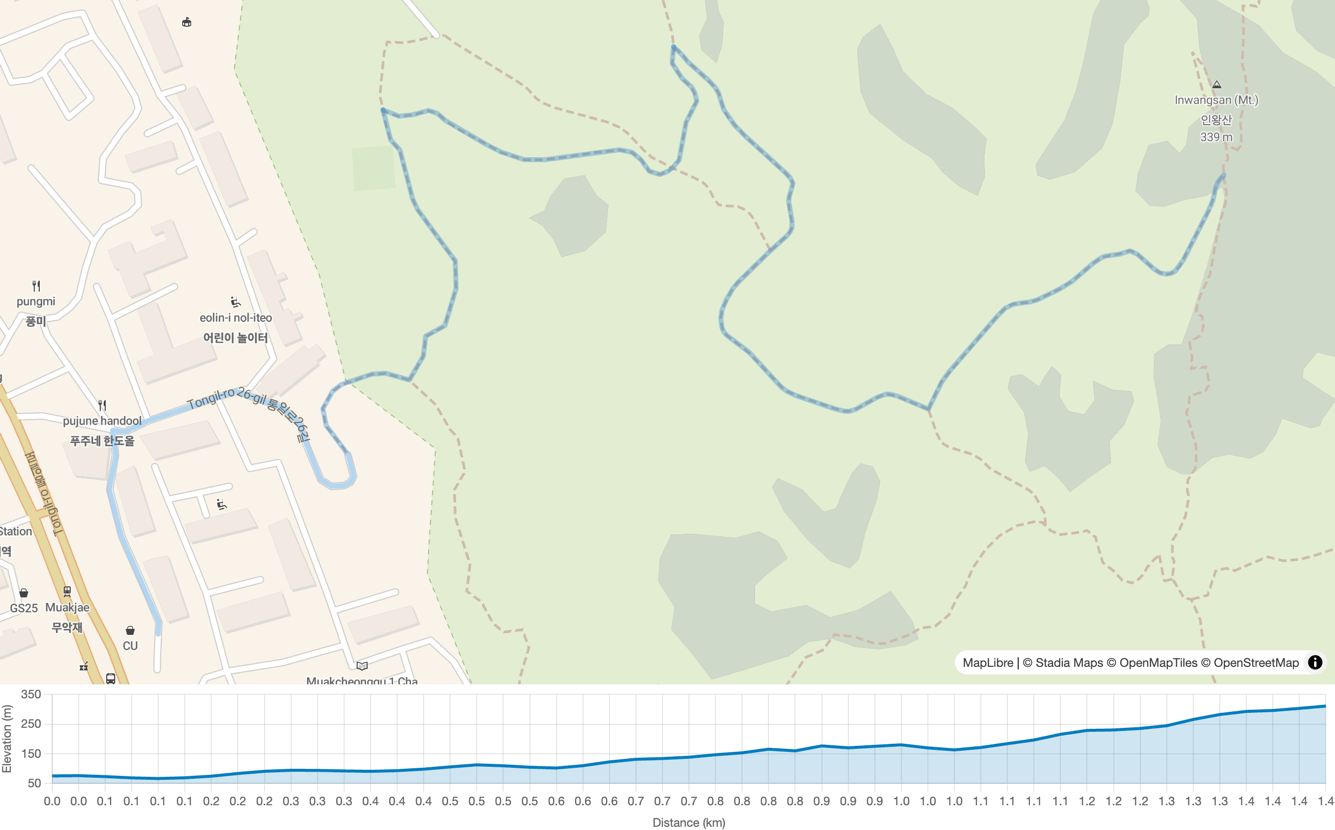
Visualizing the Elevation Profile
Now that we have the profile and know how to interpret it, let's make one of those elevation profile graphs that you may have seen on your favorite fitness app. To do this we'll use Chart.js.
First, we'll need an HTML Canvas somewhere on our page. We've added it right after our map like so:
  <body>
    <div id="map"></div>
+   <canvas id="elevation" style="height: 150px"></canvas>
    <!-- The rest of your page -->
Tip
The sizing of the canvas using a directly attached style is significant! Chart.js has a few quirks...
Creating the chart is pretty straightforward. We'll use a simple line chart style with some labeled axes.
new Chart(document.getElementById("elevation"), {
  type: "line",
  data: {
    labels,
    datasets: [
      {
        label: "Elevation (m)",
        data: elevations,
        borderColor: "#007cbf",
        fill: true,
        backgroundColor: "rgba(0, 123, 191, 0.2)",
        pointRadius: 0,
      },
    ],
  },
  options: {
    responsive: true,
    plugins: {
      legend: { display: false },
    },
    scales: {
      x: { title: { display: true, text: "Distance (km)" } },
      y: { title: { display: true, text: "Elevation (m)" } },
    },
  },
})
Bringing it all together
Here's the full example code, which you can run on JSFiddle by clicking the button below.
<!doctype html>
<html lang="en">
  <head>
    <meta charset="UTF-8" />
    <title>Hiking Route with an Elevation Profile View</title>
    <meta
      name="viewport"
      content="initial-scale=1,maximum-scale=1,user-scalable=no"
    />
    <script
      type="text/javascript"
      src="//unpkg.com/maplibre-gl@5.0.1/dist/maplibre-gl.js"
    ></script>
    <script type="text/javascript" src="//unpkg.com/@stadiamaps/api@7"></script>
    <link
      href="//unpkg.com/maplibre-gl@5.0.1/dist/maplibre-gl.css"
      rel="stylesheet"
    />

    <!-- External dependencies: a polyline parser (for drawing the route line) and Chart.js -->
    <script
      type="text/javascript"
      src="https://unpkg.com/@mapbox/polyline"
    ></script>
    <script src="https://cdn.jsdelivr.net/npm/chart.js"></script>
    <style>
      html,
      body {
        height: 100%;
        margin: 0;
        padding: 0;
        display: flex;
        flex-direction: column;
      }
      #map {
        flex: 1;
      }
    </style>
  </head>
  <body>
    <div id="map"></div>
    <canvas id="elevation" style="height: 150px"></canvas>

    <script>
      const map = new maplibregl.Map({
        container: "map",
        style: "https://tiles.stadiamaps.com/styles/outdoors.json",
        center: [126.950941, 37.582097],
        zoom: 13,
      })

      const api = new stadiaMapsApi.RoutingApi()

      async function renderRouteAndElevation() {
        const locations = [
          { lon: 126.950941, lat: 37.582097 },
          { lon: 126.957916, lat: 37.584465 },
        ]

        const elevationInterval = 30
        const response = await api.route({
          routeRequest: {
            locations: locations,
            costing: stadiaMapsApi.CostingModel.Pedestrian,
            elevationInterval: elevationInterval,
          },
        })

        // Construct a bounding box in the sw, ne format required by MapLibre. Note the lon, lat order.
        var sw = [response.trip.summary.minLon, response.trip.summary.minLat]
        var ne = [response.trip.summary.maxLon, response.trip.summary.maxLat]

        // Zoom to the new bounding box to focus on the route,
        // with a 50px padding around the edges. See https://maplibre.org/maplibre-gl-js/docs/API/classes/Map/#fitbounds
        map.fitBounds([sw, ne], { padding: 50 })

        response.trip.legs.forEach(function (leg, idx) {
          // Add a layer with the route polyline as an overlay on the map
          var layerID = "leg-" + idx // Unique ID with request ID and leg index
          // Note: Our polylines have 6 digits of precision, not 5
          var geometry = polyline.toGeoJSON(leg.shape, 6)
          map.addLayer({
            id: layerID,
            type: "line",
            source: {
              type: "geojson",
              data: {
                type: "Feature",
                properties: {},
                geometry: geometry,
              },
            },
            layout: {
              "line-join": "round",
              "line-cap": "round",
            },
            paint: {
              "line-color": "#0072ce",
              "line-opacity": 0.3,
              "line-width": 5,
            },
          })
        })

        const elevations = response.trip.legs[0].elevation
        const labels = elevations.map((_, i) =>
          ((elevationInterval * i) / 1000).toFixed(1),
        )

        new Chart(document.getElementById("elevation"), {
          type: "line",
          data: {
            labels,
            datasets: [
              {
                label: "Elevation (m)",
                data: elevations,
                borderColor: "#007cbf",
                fill: true,
                backgroundColor: "rgba(0, 123, 191, 0.2)",
                pointRadius: 0,
              },
            ],
          },
          options: {
            responsive: true,
            plugins: {
              legend: { display: false },
            },
            scales: {
              x: { title: { display: true, text: "Distance (km)" } },
              y: { title: { display: true, text: "Elevation (m)" } },
            },
          },
        })
      }

      renderRouteAndElevation()
    </script>
  </body>
</html>
Next Steps
Once you're ready to try this outside a local development environment, sign up for a free Stadia Maps account, and we'll guide you through what to do before deploying.
Get Started With a Free Account
Or, if you're still not sure whether our routing APIs have what you need, check our our guide to getting the best routes for your use case. It's a lot easier reading than API docs, and hits all the key capabilities in just a few minutes.