How to Visualize Travel Times with MapLibre GL JS and the Stadia Maps API
Free
Starter
Standard
Professional
If you're planning a trip, an apartment purchase, or otherwise trying to see what's accessible in an area, isochrones (also known as reachable range) are a powerful tool. An isochrone map shows you how far you can travel with a time or distance constraint. This lets you quickly get an idea of mobility in an area, see where you can travel given your remaining fuel/battery, and more.
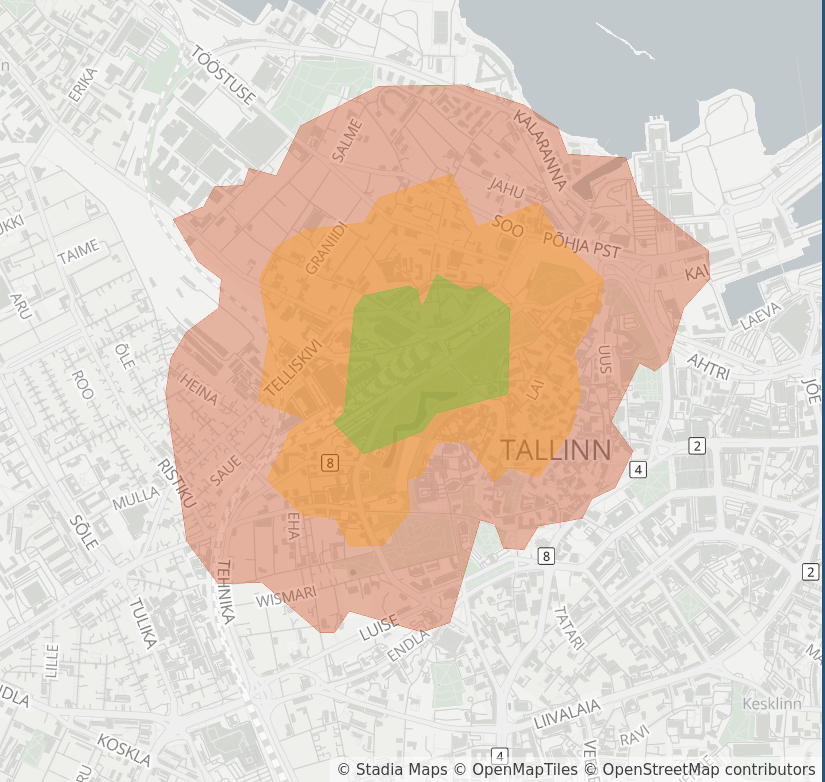
By the end of this tutorial, you'll know how to use the Stadia Maps Isochrone API to get travel time polygons in GeoJSON format, and visualize the data on an interactive map using MapLibre GL JS.

Write an API helper function
Using the Isochrone API is really simple. We'll leave the heavy lifting to our official SDK so that you can focus on what matters.
function isochrone(lat, lon, costing, callback) {
  const api = new stadiaMapsApi.RoutingApi();

  // Build an isochrone request
  const req = {
    locations: [
      {
        "lat": lat,
        "lon": lon
      }
    ],
    costing: costing,
    contours: [
      {"time": 5, "color": "33cc33"},
      {"time": 10, "color": "ff9900"},
      {"time": 15, "color": "cc3300"},
    ],
    polygons: true
  };

  api.isochrone({isochroneRequest: req}).then(callback).catch(function () {
    console.error(e);
  });
}
The lat and lon parameters indicate the point your travel will start from, and costing lets you
specify the mode of travel.
You can generate isochrones for nearly a dozen modes of travel, including auto, bicycle, and pedestrian.
You can find the full list of parameters in the API reference.
Internally, our helper function also specifies a list of contours. These are set at 5, 10, and 15 minutes of travel time respectively. The color argument is passed through in the resulting GeoJSON feature properties, which we'll consume later.
Visualize the isochrones
The helper function takes a callback as its final argument. We'll use this to add a new layer to the map.
We'll use the addLayer function on
our MapLibre GL JS map to do this. The layer type needs to be set to fill for this example because we're
trying to draw filled in polygons. The response can be passed in directly as the source data.
In the paint section, we set the fill-color and fill-opacity using a get expression. The colors that
we specified in the contours part of the request body are passed through in the resulting features, so
the 5 minute polygon will be green, the 10 minute, orange, and the 15 minute, red.
Tip
You can also ask the isochrone API to return LineStrings instead, in which case you would use a line
layer, and change the paint properties to their line equivalents.
isochrone(59.437222, 24.745278, "pedestrian", function(response) {
    map.addLayer({
        "id": "isochrone",
        "type": "fill",
        "source": {
            "type": "geojson",
            "data": response
        },
        "layout": {},
        "paint": {
            "fill-color": ["get", "color"],
            "fill-opacity": ["get", "opacity"],
        }
    });
});
Put it in a webpage
That's it. We have all the pieces to make this work. We'll do the work and provide the boilerplate page with a full-screen map. Try it out now on JSFiddle.
<!DOCTYPE html>
<html>
  <head>
    <meta charset="utf-8" />
    <title>Isochrone Demo</title>
    <meta name="viewport" content="initial-scale=1,maximum-scale=1,user-scalable=no" />
    <script type="text/javascript" src="//unpkg.com/maplibre-gl@5.0.1/dist/maplibre-gl.js"></script>
    <script type="text/javascript" src="//unpkg.com/@stadiamaps/api@7"></script>
    <link href="//unpkg.com/maplibre-gl@5.0.1/dist/maplibre-gl.css" rel="stylesheet" />

    <style type="text/css">
      body {
        margin: 0;
        padding: 0;
      }

      #map {
        position: absolute;
        top: 0;
        bottom: 0;
        width: 100%;
      }
    </style>
  </head>
  <body>
    <div id="map"></div>
    <script type="text/javascript">
      function isochrone(lat, lon, costing, callback) {
        const api = new stadiaMapsApi.RoutingApi();

        // Build an isochrone request
        const req = {
          locations: [
            {
              "lat": lat,
              "lon": lon
            }
          ],
          costing: costing,
          contours: [
            {"time": 5, "color": "33cc33"},
            {"time": 10, "color": "ff9900"},
            {"time": 15, "color": "cc3300"},
          ],
          polygons: true
        };

        api.isochrone({isochroneRequest: req}).then(callback).catch(function () {
          console.error(e);
        });
      }

      var map = new maplibregl.Map({
        container: "map",
        style: "https://tiles.stadiamaps.com/styles/alidade_smooth.json",  // Style URL; see our documentation for more options
        center: [24.73715, 59.43995],  // Initial focus coordinate
        zoom: 13
      });

      // MapLibre GL JS does not handle RTL text by default,
      // so we recommend adding this dependency to fully support RTL rendering if your style includes RTL text
      maplibregl.setRTLTextPlugin('https://unpkg.com/@mapbox/mapbox-gl-rtl-text@0.2.3/mapbox-gl-rtl-text.min.js');

      // Add zoom and rotation controls to the map.
      map.addControl(new maplibregl.NavigationControl());

      // Get pedestrian isochrones from Balti Jaam in Tallinn, Estonia
      isochrone(59.43995, 24.73715, "pedestrian", function(response) {
        map.addLayer({
          "id": "isochrone",
          "type": "fill",
          "source": {
            "type": "geojson",
            "data": response
          },
          "layout": {},
          "paint": {
            "fill-color": ["get", "color"],
            "fill-opacity": ["get", "opacity"],
          }
        });
      });
    </script>
  </body>
</html>
Next steps
The isochrone API is highly configurable with parameters such as walking speed, bicycle type, and more. Try playing around with the code in an editor like VSCode or WebStorm to take advantage of auto-complete hints, or check out the full API reference for details.
Once you're ready to go live with your own website, you'll need a Stadia Maps account with a Standard or Professional subscription.