Add 3D Buildings to your Maps
Free
Starter
Standard
Professional
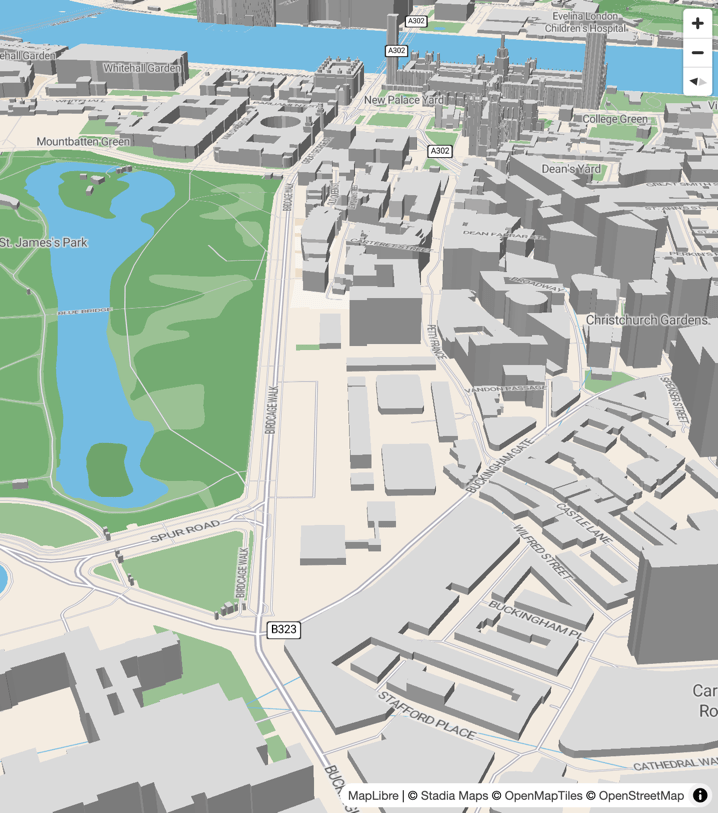
Most maps are flat, looking straight down at the earth from above. But sometimes you need to look at things from another angle. Navigation apps, for example, often have a camera pitch between 45 and 60 degrees to show the area around and in front of the vehicle better.
At this angle, your maps can really come to life with 3D buildings. This tutorial will show you how to add 3D buildings to any map style using MapLibre and vector basemap tiles from Stadia Maps.
Build the Layer
The look and feel of your map is controlled by a stylesheet using a JSON MapLibre style. It defines the data sources and layers, which order rendering should happen in, and various attributes of the layers that make up your map.
A fill-extrusion
layer lets us create a 3D effect by extruding portions of buildings
from height information already present in the vector tile.
The result isn't as detailed as a 3D model or point cloud,
but it's fast, and saves precious data for mobile users.
{
  "id": "3d-buildings",
  "source": "openmaptiles",
  "source-layer": "building",
  "filter": [
    "!",
    [
      "to-boolean",
      ["get", "hide_3d"]
    ]
  ],
  "type": "fill-extrusion",
  "minzoom": 13,
  "paint": {
    "fill-extrusion-color": "lightgray",
    "fill-extrusion-height": [
      "interpolate",
      ["linear"],
      ["zoom"],
      13,
      0,
      16,
      ["get", "render_height"]
    ],
    "fill-extrusion-base": [
      "case",
      [">=",
        ["get", "zoom"],
        16
      ],
      ["get", "render_min_height"],
      0
    ]
  }
}
If you're familiar with MapLibre style documents already,
this might look familiar.
The first few property names describe themselves:
an id gives a layer a unique identifier,
minzoom specifies the minimum zoom at which the layer will render, and so on.
If you're starting from a style developed internally at Stadia Maps,
it has an OpenMapTiles schema-compatible source named openmaptiles.
If you're adding buildings to one of our Stamen-designed styles,
change the source identifier to stamen-omt.
The filter is an example of an expression,
which lets you make a decision according to some rules.
If you've written LISP before, this might look like a predicate function with weird syntax.
In our example, we are excluding features in the building layer with hide_3d set to a truth-y value.
(The hide_3d property is set on building parts which are underground.)
The paint property is where we specify how the building will look.
The fill-extrusion-color determines the exterior color.
We've selected a neutral light gray.
The fill-extrusion-height and fill-extrusion-base properties determine
how the building is extruded.
The effect of our choices here is to make the building "scale in" as you zoom.
Add the Layer to a Style
Integrating into a Custom Style
If you're building a custom style already, just add the new layer where you'd like it in your JSON! This currently requires a bit of work, but we're working to make that easier. Let us know if you'd like to be kept up to date on custom style hosting.
Modifying an Existing Style Dynamically
You can also modify an existing style in-place after it's loaded into the map! Use this approach with care, as things like layer identifiers or ordering may change over time.
Here's an example of how you could do this in MapLibre GL JS. MapLibre Native offers similar APIs.
map.addLayer({
  'id': '3d-buildings',
  'source': 'openmaptiles',
  'source-layer': 'building',
  'filter': [
    "!",
    ["to-boolean",
      ["get", "hide_3d"]
    ]
  ],
  'type': 'fill-extrusion',
  'minzoom': 13,
  'paint': {
    'fill-extrusion-color': 'lightgray',
    'fill-extrusion-height': [
      'interpolate',
      ['linear'],
      ['zoom'],
      13,
      0,
      16,
      ['get', 'render_height']
    ],
    'fill-extrusion-base': ['case',
      ['>=', ['get', 'zoom'], 16],
      ['get', 'render_min_height'], 0
    ]
  }
},
labelLayerId  // Replace this with the ID of a layer in the style; the new layer will be added below this
);
Full Example in MapLibre GL JS
Bringing everything together, here is some sample code which adds a 3D buildings layer to one of our styles.
To keep it relatively simple and future-proof, we add the buildings directly under the first symbol layer.
To make experimenting easy, we've packaged the example code as a JSFiddle playground. Click the "Try it in JSFiddle" button to try it right from your web browser.
<!DOCTYPE html>
<html>
    <head>
        <meta charset="utf-8" />
        <title>Vector Map Demo</title>
        <meta name="viewport" content="initial-scale=1,maximum-scale=1,user-scalable=no" />
        <script type="text/javascript" src="//unpkg.com/maplibre-gl@5.0.1/dist/maplibre-gl.js"></script>
        <link href="//unpkg.com/maplibre-gl@5.0.1/dist/maplibre-gl.css" rel="stylesheet" />
        <style type="text/css">
            body {
              margin: 0;
              padding: 0;
            }

            #map {
              position: absolute;
              top: 0;
              bottom: 0;
              width: 100%;
            }
        </style>
    </head>
    <body>
        <div id="map"></div>
        <script type="text/javascript">
         var map = new maplibregl.Map({
           container: 'map',
           style: 'https://tiles.stadiamaps.com/styles/alidade_bright.json',  // Style URL; see our documentation for more options
           center: [-0.13710, 51.5], // Initial focus coordinate
           zoom: 16,
           pitch: 60,
           bearing: 82
         });

         // MapLibre GL JS does not handle RTL text by default,
         // so we recommend adding this dependency to fully support RTL rendering if your style includes RTL text
         maplibregl.setRTLTextPlugin('https://unpkg.com/@mapbox/mapbox-gl-rtl-text@0.2.3/mapbox-gl-rtl-text.min.js');

         // Add zoom and rotation controls to the map.
         map.addControl(new maplibregl.NavigationControl());

         // Wait for the map to load, then manipulate the style
         map.on('load', () => {
          const layers = map.getStyle().layers;

          // Find the first symbol layer.
          // We'll add buildings just under this for the example.
          let labelLayerId;
          for (let i = 0; i < layers.length; i++) {
            if (layers[i].type === 'symbol' && layers[i].layout['text-field']) {
              labelLayerId = layers[i].id;
              break;
            }
          }
          map.addLayer({
              'id': '3d-buildings',
              'source': 'openmaptiles',
              'source-layer': 'building',
              'filter': [
                "!",
                ["to-boolean",
                  ["get", "hide_3d"]
                ]
              ],
              'type': 'fill-extrusion',
              'minzoom': 13,
              'paint': {
                'fill-extrusion-color': 'lightgray',
                'fill-extrusion-height': [
                  'interpolate',
                  ['linear'],
                  ['zoom'],
                  13,
                  0,
                  16,
                  ['get', 'render_height']
                ],
                'fill-extrusion-base': ['case',
                  ['>=', ['get', 'zoom'], 16],
                  ['get', 'render_min_height'], 0
                ]
              }
            },
            labelLayerId
          );
        });
        </script>
    </body>
</html>
Next Steps
Ready to add maps with 3D buildings to your website or app? Sign up for a free Stadia Maps account to get started!
Get Started With a Free Account
If you want to craft even more detailed building styles, the MapLibre style documentation covers other styling options including patterns, gradients, and more.
Finally, if you're building a navigation experience, check out Ferrostar, our highly extensible navigation SDK.